
Things I know: Part II
Things I know: Part II
The Making of a Viral Coup

An apparent history of COVID-19 in America
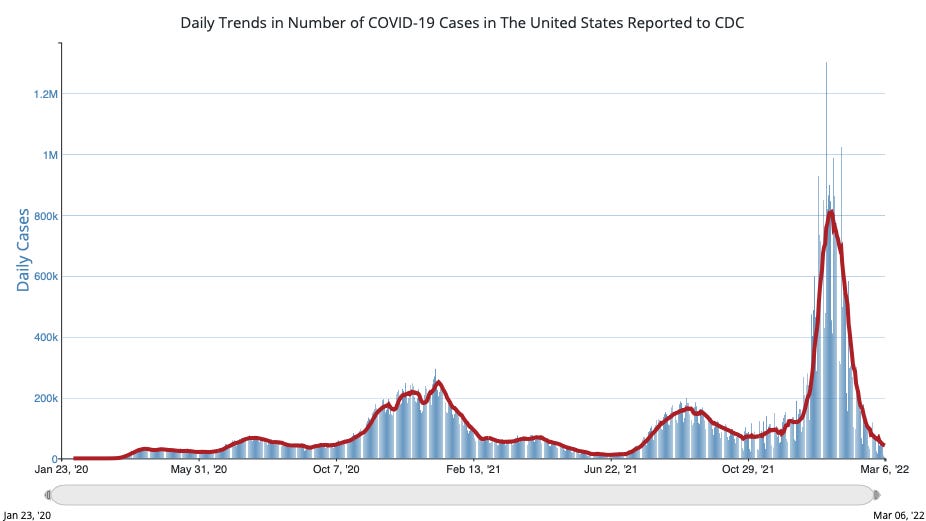
The graph is an “apparent” history of the course of COVID-19 in America because we now know several things that cast some doubt on the true number of cases. First, CDC has recently stated that the Polymerase Chain Reaction test (PCR) was both intentionally conducted in a manner that artificially increased positive findings and that on its own the PCR test is known to render false positives. Second, and this is the most heinous—Rochelle Walensky has casually noted that CDC had been withholding data “…on hospitalizations due to COVID-19 in the United States broken down by age, race, and vaccination status.”
In short, CDC headed by Rochelle Walensky has lied to us about the true extent of the epidemic of SARA-CoV-2 in the United States. Walensky’s reason for doing this? She was concerned that we would “misinterpret the data”. I wrote about this and its implication on 28 February 2022. This isn’t first time that CDC has manipulated the data to tell us a story that made spread and impact this disease appear to be worse than it really has been and she was aided by democrat politicians and a media eager to remove a sitting president by any means possible. What better way than to blame him for an out of control killer epidemic which they charged he had clearly mishandled.
CDC’s data manipulation began in early 2020 as detailed in a wonderful telling of the history of data manipulation by Henry Ealy et al. in October 2020. So what did CDC do? In brief, and please read Ealy’s article — and have plenty of duct tape at your side — they ignored the legal requirement to have all plans for data collection published in the Federal Register so that the public could comment on those plans and make recommendations for their improvement. Instead in February of 2020 CDC simply adopted the recommendations for data collection made by the non-governmental Council of State and Territorial Epidemiologists, a body with no legal authority to establish government policy.
Then in March of that same year they quietly altered how COVID-19 would be used in the recording of Cause of Death in strict violation of The Paperwork Reduction Act and the Information Quality Act both intended to ensure high quality , unbiased, and accurate data collection.
By March of 2020 the CDC had ensured that neither the White House nor the American People would have a true picture of SARS-CoV-2 and COVID-19 in America. It wasn’t until the summer of 2020 that the White House would understand what CDC had done. On July 15, 2020 the Department of Health and Human Services, CDC’s parent agency wrenched data collection from the hands of CDC but the damage had been done.
An eager media and a democrat party as well as a few republicans began blaming President Trump for every COVID-19 death and they all hid the fact that CDC had blurred the distinction between people who had died FROM COVID-19 and those who had died WITH COVID-19. Its wasn’t until 2021 that the CDC was forced to admit that roughly only 6% of all deaths attributed to COVID-19 had occurred among otherwise healthy people. The remaining 94% were found to have had somewhere between 2 and 6 serious co-morbidities each. In other words, most of those listed as having died FROM COVID-19 had most likely died from other causes. Many believe that this deceit contributed substantially to Donald Trump’s defeat in November of 2020
Walensky became Director of CDC in January of 2021 but failed to mention any of this until February of 2022.
To be clear, Walensky is not a heroine who entered her directorship, discovered misdeeds, brought them to the attention of the American People, and fixed the problems. In fact, as noted above, we now know that Walensky intentionally withheld data from Congress and the People. We also know that Walensky has not offered a single remedy. As a result the true number of COVID-19 deaths among otherwise healthy people will most likely never be known.
The laws governing data collection and the recording of cause of death were broken causing our view of the magnitude of the seriousness of the SARS-CoV-2 “pandemic” to be grossly over stated. But data collection wasn’t the only way to overstate the data that was used by the CDC. The presentation of that data was equally damaging to the Trump campaign and our understanding of what was really happening in the country.
The “True” Case Rate
The question for CDC and others was: How do we present the data to the Nation? CDC and an eager media settled on total daily cases which is how the graph at the top was constructed. But does this really tell us how the infection is affecting the nation? Is it a useful measure for setting public health policy? The answer to both is no. But it is most certainly a good way to stir up the public and instill fear.
The more telling metric is this: What is the percentage of the US population was infected by SARS-CoV-2?
On January 9, 2021 CDC and the media reported that there were 255,778 new cases of COVID-19 in the United States which was a new “record”. Two-hundred fifty-five thousand, seven hundred and seventy-eight cases sounds like an awful lot of sick people. But if that number is expressed as a percentage of the entire US population it is a mere 0.078%. Just 30 days later on February 9, 2021 the number of new cases fell to 91,570 or 0.028% of the entire us population. These are much smaller figures compared to the total number and they give us some indication of exactly how many Americans had COVID-19 but more importantly how many did not.
The CDC and the media were also quick to tell us how many people had died each day and in total.
As of March 6, 2022 CDC reports that 79,094,974 Americans had contracted COVID-19 and 955,958 of those had died either WITH or FROM COVID-19. In other words 1.2% of those who contracted COVID-19 died which means that 98.8% survived. Rounding up to 99% that means that you have 99 chances out of 100 of recovering from COVID-19. Imagine going to Vegas knowing that your odds of winning were 99 to 1.
Also keep in mind that those cumulative numbers are from almost three years worth of data collection AND that the mortality data was intentionally inflated by attributing COVID-19 as the cause of death even if it was only an underlying reason OR it was based on a false positive PCR test.
Using CDC’s own estimate that only 6% of all COVID-19 deaths occurred among otherwise healthy people then the “COVID only mortality” rate was (955,958) X 0.06 = 57,357.48 or 0.07%. If a person is otherwise healthy there is a 99.93% chance of recovering from COVID-19.
The CDC also refused to acknowledge natural immunity AND extraordinarily inexpensive and highly effective treatments that were known to prevent hospitalizations and deaths.
CDC was part of the cabal that withheld not just data but information on treatments that work. And that my friends is against secular law and God’s law.
“If anyone causes one of these little ones—those who believe in me—to stumble, it would be better for them to have a large millstone hung around their neck and to be drowned in the depths of the sea. 7Woe to the world because of the things that cause people to stumble! Such things must come, but woe to the person through whom they come!” Matthew 18:6-7
Union, KY
8 March 2022
Larry, in what manner did HHS wrench control of data collection from the CDC in July 2020? That is something I obviously missed while following all this for the last two years. I am amazed at how many 'federations' and 'councils of subsidiary state organizations there are, from the education bureaucracy to now, the "council" of "state and territorial epidemiologists". WTF are they?- M Robert weiss, MD, (neurosurgery)